
"ChartNet: The Million-Scale Dataset Behind Robust Chart Understanding"
When Docling extracts structured tables from charts, it relies on vision-language models (VLMs) that can read a bar chart the way an analyst would: recognizing the geometry, recovering the numbers, and organizing them into a tabular format. Getting models to do this reliably has long been bottlenecked by one thing — data. Existing chart datasets are small, narrow in chart types, or missing critical modalities such as plotting code, data tables, or reasoning traces.
ChartNet, presented at CVPR 2026, addresses this gap head-on. It is the largest open dataset of its kind: millions of high-quality chart samples, each pairing a rendered chart image with its plotting code, underlying data table, natural-language summary, and question-answer pairs with chain-of-thought reasoning. The dataset is the result of a collaboration between MIT, the MIT-IBM Watson AI Lab, and IBM Research, and it is available now on Hugging Face.
What's in ChartNet
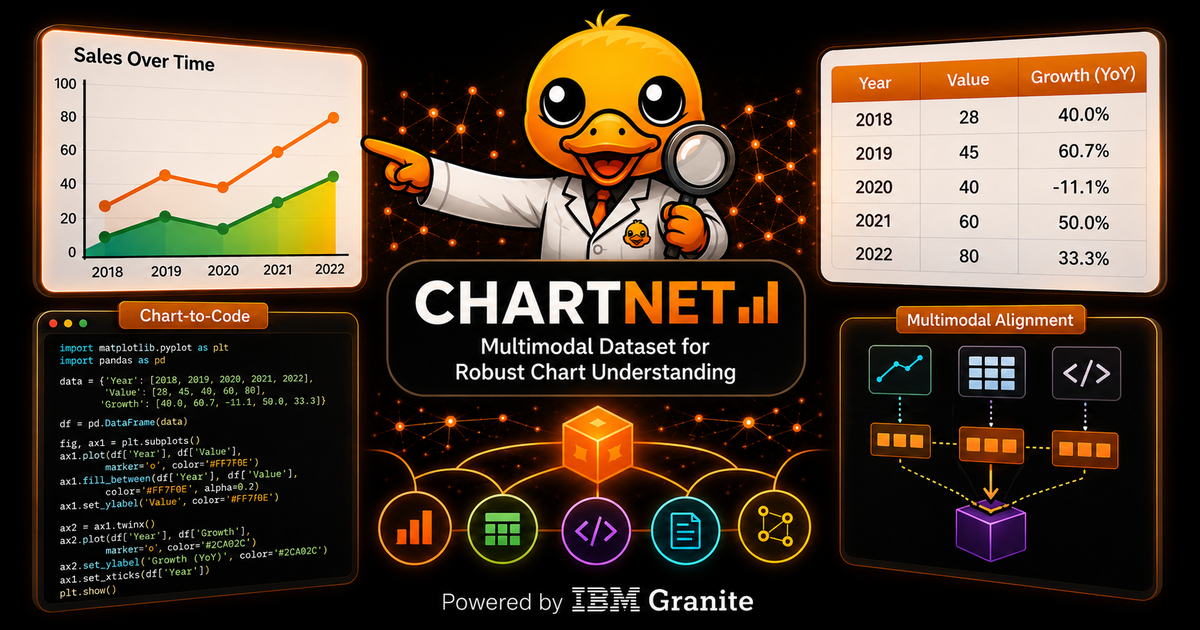
The key design principle of ChartNet is cross-modal alignment: every sample connects five components that describe the same chart.
- Plotting code — executable Python that generates the chart
- Rendered chart image — the visual itself
- Data table (CSV) — the underlying values
- Natural-language summary — a grounded description of patterns and trends
- QA pairs with reasoning — multi-step questions with chain-of-thought traces
This alignment is what makes the dataset so effective as supervision: a model trained on ChartNet sees not only what a chart looks like, but also the structured data and the program that produced it.
The numbers, as of the latest release:
| Synthetic chart samples | 4.2M (2.5M under permissive licensing) |
| Human-verified samples | 94,643 (+ a 2,000 held-out test set) |
| Real-world charts | 30K (curated with Abaka AI/2077AI) |
| Chart types | 24 — from bar and line charts to treemaps, radar, violin, and tornado charts |
| Plotting libraries | 6 |
Beyond the core synthetic dataset, specialized subsets cover grounding (QA pairs with bounding boxes for region-aware comprehension), human-verified examples for high-precision training and evaluation, curated real-world charts from sources like the World Bank, Pew Research Center, and Our World in Data, and safety-focused preference data designed to mitigate harmful outputs in chart contexts (coming soon).
How it was built: code-guided synthesis
Charts are generated programmatically — so executable plotting code is a natural structured intermediate representation for them. ChartNet exploits this with a code-guided generation pipeline: starting from a seed set of chart images, a VLM reconstructs each chart as Python plotting code. An LLM then iteratively augments that code, varying chart types, plotting libraries, styles, and data, to produce visually and semantically diverse charts at scale. Because every chart originates from code, the aligned tables, summaries, and QA pairs can be derived with the code as grounding context — keeping the modalities tightly coupled.
A rigorous quality-filtering stage closes the loop. In a human study, filtering reduced the fraction of charts flagged with readability-affecting issues to <5.9%.
Why this matters for Docling
ChartNet is directly connected to the Docling family of models. In the CVPR paper, fine-tuning granite-docling-258M on ChartNet boosts chart data extraction from 17.7 to 32.0, chart summarization from 24.1 to 55.5, and chart QA with reasoning from 54.0 to 61.0, while unlocking chart-to-code generation entirely (the base model could not produce valid plotting code at all).
The trend holds across scales, with a striking headline result: a ChartNet-tuned granite-vision-3.3-2b reaches 70.3% on chart data extraction — far ahead of GPT-4o's 46.7% — and 83.9% on chart summarization, surpassing baselines an order of magnitude larger. The gains also transfer beyond ChartNet's own evaluation suite, with large improvements on public benchmarks such as ChartCap and ChartMimic-v2.
For the Docling community, this is the capability that matters most: accurate chart-to-CSV extraction is exactly what powers Docling's chart enrichment (enabled via the --enrich-chart-extraction option), which uses Granite Vision to turn chart images into structured, machine-readable tables.
ChartNet has since been used to train the Granite Vision 4 series (Granite-4.0-3B-Vision and Granite-Vision-4.1-4B). The takeaway for document AI: for tightly coupled visual-numerical-linguistic domains like charts, high-quality code-aligned multimodal supervision beats sheer model scale.
Trying chart extraction with Granite Vision
The latest Granite-Vision-4.1-4B exposes ChartNet's core tasks through simple task tags — <chart2csv>, <chart2summary>, and <chart2code> — which the chat template automatically expands into full prompts:
# Requires: transformers>=5.8.0, torch, pillow
import torch
from transformers import AutoProcessor, AutoModelForImageTextToText
from PIL import Image

model_id = "ibm-granite/granite-vision-4.1-4b"
device = "cuda" if torch.cuda.is_available() else "cpu"

processor = AutoProcessor.from_pretrained(model_id)
model = AutoModelForImageTextToText.from_pretrained(
    model_id, dtype=torch.bfloat16, device_map=device
).eval()

chart = Image.open("chart.jpg").convert("RGB")

# ChartNet's core tasks:
#   <chart2csv>     -> underlying data table as CSV
#   <chart2summary> -> natural-language description
#   <chart2code>    -> Python code that recreates the chart
for task in ["<chart2csv>", "<chart2summary>", "<chart2code>"]:
    conversation = [{"role": "user", "content": [
        {"type": "image"},
        {"type": "text", "text": task},
    ]}]
    text = processor.apply_chat_template(
        conversation, tokenize=False, add_generation_prompt=True
    )
    inputs = processor(text=text, images=[chart], return_tensors="pt").to(model.device)
    out = model.generate(**inputs, max_new_tokens=4096)
    print(f"{task}:\n{processor.decode(out[0, inputs['input_ids'].shape[1]:], skip_special_tokens=True)}\n")
Within Docling, the same ChartNet-trained model family drives chart data extraction directly in the conversion pipeline — install with pip install "docling[granite_vision]" and see the chart extraction example.
Getting started
ChartNet integrates with the Hugging Face datasets library. The default core_permissive subset (2.5M samples) is released under the Community Data License Agreement – Permissive 2.0:
from datasets import load_dataset

# Default permissive subset (CDLA-Permissive-2.0)
core_permissive = load_dataset("ibm-granite/ChartNet", "core_permissive")
The subsets corresponding to the paper's experiments are also available:
# Core and reasoning subsets (joinable on the "id" column)
core = load_dataset("ibm-granite/ChartNet", "core")
reasoning = load_dataset("ibm-granite/ChartNet", "reasoning")

# Human-verified train/test splits (disjoint from the other subsets)
human_verified_test = load_dataset("ibm-granite/ChartNet", "human_verified", split="test")

# Grounded QA with bounding boxes
grounded_qa = load_dataset("ibm-granite/ChartNet", "grounded_qa", split="train")
Tip Each subset can be several hundred gigabytes. To explore before committing to a full download, load a single file:
python
first_core_file = load_dataset("ibm-granite/ChartNet", data_files="core/core_000.parquet")
print(first_core_file.shape)  # {'train': (10000, 5)}
Try it, build on it, tell us what you find
Whether you are fine-tuning a compact VLM for chart extraction, building evaluation suites for chart reasoning, or studying grounded multimodal alignment, ChartNet offers an open, large-scale foundation — and we would love to see what the community does with it.
- 📦 Dataset: huggingface.co/datasets/ibm-granite/ChartNet
- 📖 Paper (CVPR 2026): arxiv.org/abs/2603.27064
- 🌍 Real-world charts subset: ChartNet_RealWorldChart
- 📊 Chart understanding in Docling: from visuals to structured tables
Questions, findings, or ideas for new subsets? Join the discussion on the dataset's community tab or reach out to the Docling community.